
If you're an istock contributor you will already be aware of the new Getty images "ESP" submission platform coming soon and the closure of the existing submission system at istockphoto (aka "xnet"). Somewhat annoyingly the powers that be have decided not to migrate data from the old platform; said platform has been somewhat hobbled for the past couple of months anyway, but now is an excellent time to take a look at the stats over the years before they're gone for good!
I started uploading to iStockphoto in 2003. A lot has changed - I’m not even 100% certain I wasn't still on dial up in the UK, if not I was certainly on my first cable modem with 600Kbits/s symmetric (and wow did I think that was the dogs dangalies back then...)
Uploads over the years - growing portfolio
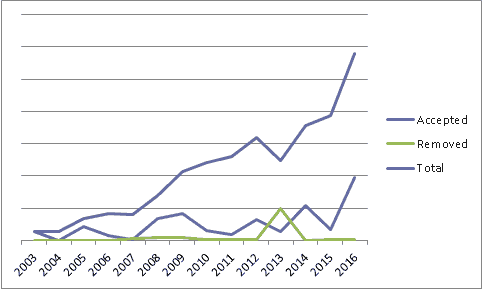
Total is cumulative and the upper line (sorry about the colours here). This graph is mostly for reference and useful when looking at the next graphs. There's not really much to say here, I’ve been adding images at a sporadic but linear-ish rate (I did upload more than average in 2016).
Downloads (sales)
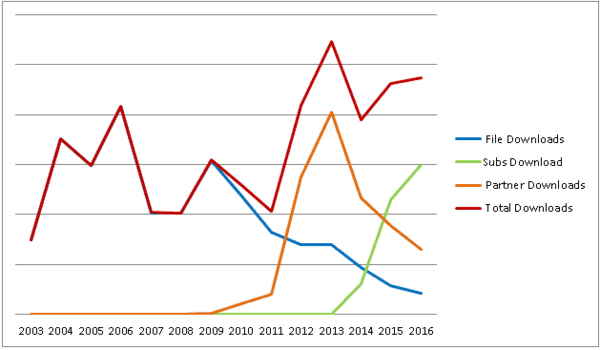
Before 2009 "file downloads" were all there was. Since then we can see individual file sales decreasing, made up for in volume by sales from partner program and subscriptions
Revenue (Total Royalties)
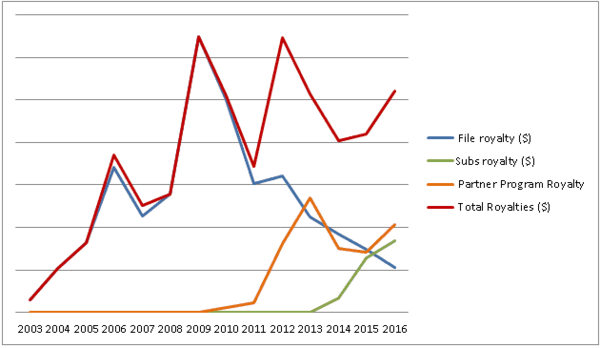
Overall, averaged out over the years revenue is on the way up. I'd hope so considering I'm uploading more images! More images in the portfolio means we need to look at RPI [3]...
Revenue Per Image
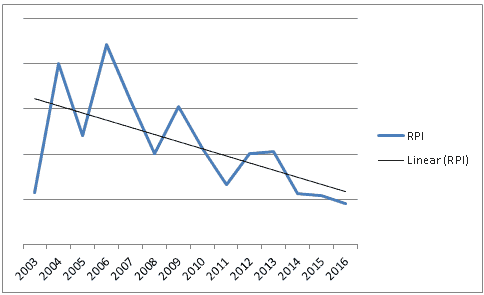
RPI is going down, but not as much as I was expecting, nonetheless it's approx. half to 1/3 of what it was for 2009 and before.
But, there is a big problem with looking at RPI, especially over long time frames, it's capable of being diluted by old images in my portfolio. I don't curate my portfolio once uploaded (to make the playing field level for all agencies to compare).
I don't have an easy way of calculating RPI for a rolling window of images uploaded in the previous 3 or 5 years, I think that might be a more useful statistic and less prone to error.
Hopefully there is something here to compare your own results with. Certainly not as gloomy as I thought things might have been; especially industry wide considering how much ground istock have lost to shutterstock.
Notes:
- For clarity ELs not included in the graphs.
- If you are playing along at home with your own stats, as of 2011 the stats show deactivations as negative numbers, they were positive numbers before that, I’ve taken absolute values of all years (and yes I would like a vodka please).
- 2003 was 5 months of a year and hence is "statistically flawed"
- Results for December 2016 are missing and hence values will be approx. 1/12th higher than shown - December in my portfolio is more or less on par with other average months. Sep-Nov are good months for me as is commonly seen in the industry. I think this is actually quite important as it could make the RPI at istock constant over the past 3 years.